Runners love discussing weekly mileage, runners love discussing training intensity. Pace…heart rate…percentage VO2 max – there are many ways to describe intensity. These descriptions fall into two categories – external load and internal load.
External load
External load applied to running intensity is simply running pace/speed, and perhaps some other things like hills, thermal conditions, and wind speed. These metrics are easy to measure and don’t require much interpretation. Running pace is probably one of the first things you record in your training log because it’s what you are training for – an objective measure of your performance.
It’s easy to monitor external metrics of intensity with a modern GPS running watch, which is readily available to most people. Such a watch does all the work for you via a convenient upload to an app at the end of your training day. Your watch will even monitor the hills and temperature/wind by using your location to check a map and weather report.
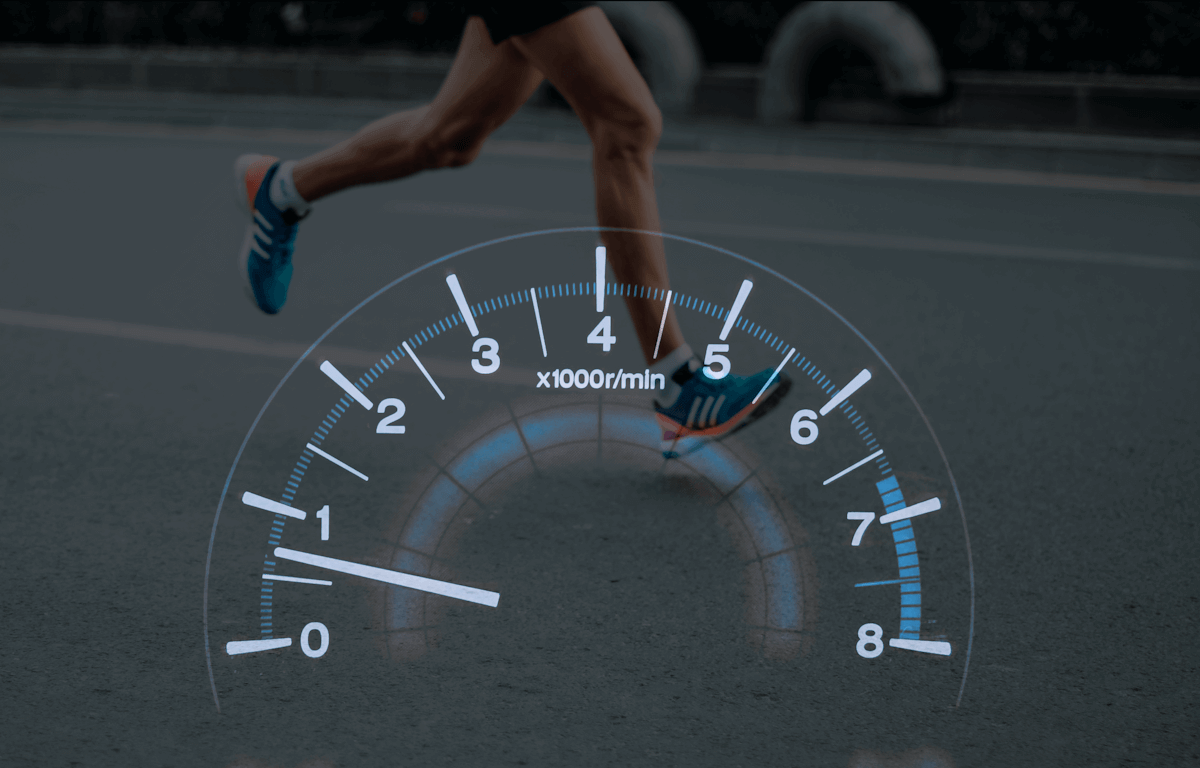
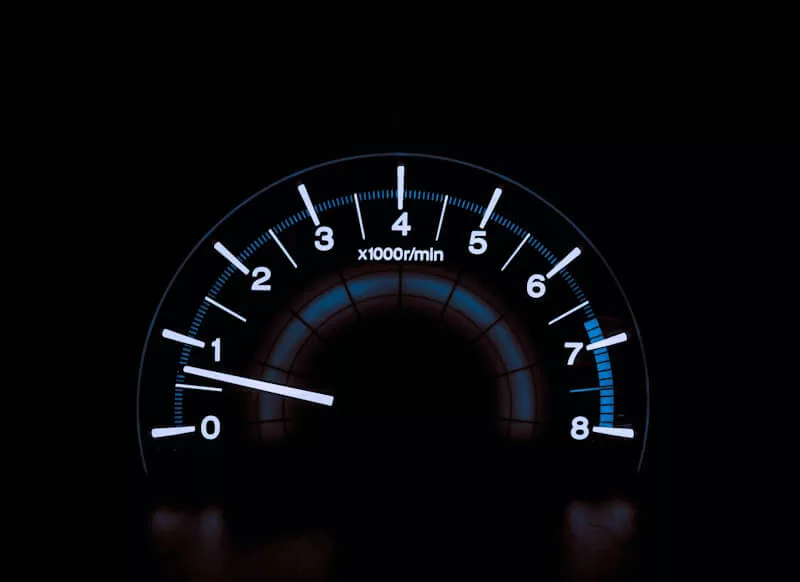
What the external load (just like the speedometer on a car) doesn’t say, however, is how all of this affects you. A car uses a tachometer to measure how fast the engine is going. Your personal response to the training is reflected in the internal load – your individual physiological tachometer.
Internal load
To distinguish internal load from external load, we use the example of hill running. For the same effort, running uphill is slower than running downhill. For the same speed, running uphill is harder than running downhill. Overcoming or working with gravity makes all the difference and this is seen in your physiological response that reflects internal load.
Uphill running tends to stress the physiology of your energy supply system. It also stresses muscular force generation – you need to push harder with each step, but this pushing will be at a slower speed. Yet, it also relieves the burden of pounding. So, if you want maximal physiological intensity with minimal stress from pounding, choose uphill running. But your biomechanics will be different – you will have a shorter running stride, and you will likely lean a bit more into the hill.

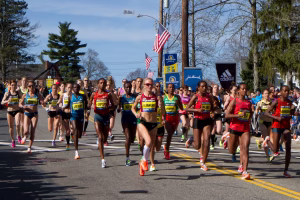
Downhill running adds to the stress from pounding. Unless this downhill running is highly technical requiring extreme agility, your heart rate and breathing rate will be relatively low. But your leg muscles will need to contract very intensely and very rapidly. This is the most destructive aspect of running and illustrates why the Boston Marathon is a challenging course. The downhills in the early miles “destroy” your legs, which limits your pace in the later miles.
Most people remember to monitor metrics like heart rate during hill training. However, many forget that the accumulation of pounding should also be monitored carefully. Too much pounding can lead to overtraining or even an overuse injury if your legs are not yet resilient enough to tolerate that stress.
The above examples illustrate why it is important to understand internal load and the specific effects on different parts of your body. Normal training progression gradually increases internal load as long as you can tolerate it. But monitoring only energy supply systems such as heart rate and breathing can lead to disaster if the muscles, tendons, ligaments, and bones of your mechanical system. So, if the car’s tachometer is like your physiological motor that supplies energy, the frame, suspension, and tires of the car is like your mechanical system. Remember that a car that must drive on an extremely bumpy road will eventually break apart due to wear and tear, even though the engine itself is fine. You must think the same way about training stress.
Two athletes: same training session, different response
The other important example to make is when two athletes train together. Even with the exact same training session, they will likely have different responses. In other words, the external load will be the same but the internal load will be different.
It’s important to realize this when you are training with a group. The benefits of camaraderie and fellowship around this amazing sport should not be minimized. But each athlete should monitor their own response to the training session and realize that what might be a good amount for one person may be too much or too little for others. So, one person gets the ideal, one person gets injured, and one person is held back.
How to measure your internal training load
Heart rate
The most common measure of internal load is heart rate. Heart rate is responsive to hills, wind, temperature, and fatigue. It will even change if you lose body fat because running with less weight is physiologically easier at the same speed. This effect is even more pronounced for uphill running.
Your heart rate ranges from “resting” to “maximal”. Both of these are measurable and most people quantify that as a percentage of maximum. You can find a more in-depth treatment of heart rate training here [link; perhaps embed a card]. Forming a set of individualized heart rate training zones can help you dial in the correct intensity for each training day and help focus on training for a specific race distance.
Breathing
Breathing goes hand-in-hand with heart rate because your heart is pumping oxygen and carbon dioxide that is taken in and removed by your lungs. Breathing is also the variable about which you will be most aware during stressful running.
The problem with breathing is that it isn’t that precise, although sometimes the concept of “conversation pace” is used to ensure an appropriate low intensity during recovery runs. Conversation pace refers to running intensities that are low enough that you can carry on a conversation with a running partner without too much difficulty. When you can only say a few words at a time and are gasping for air, the intensity is no longer conversational.
Oxygen consumption
Oxygen consumption (VO2) refers to the oxygen that you take in and use to supply energy to your working muscles. This is the main method of energy supply for distance running. Oxygen consumption ranges from resting values to VO2 max, which can increase 20-fold or more over resting values.
The main problem with VO2 measurement is that it requires expensive equipment usually available only at universities and national sports training centers. It is not ordinarily possible for most people to use this in their training, nor do I believe it is necessary. It is usually used to measure overall cardiovascular fitness and prescribe training intensity zones. My opinion of this is that overall fitness should be demonstrated from race performances, and other methods of monitoring training intensity can provide similar precision when constructing a system of training zones.
Blood lactate
Blood lactate training has long been a part of training discussions. The major principle is that higher running intensities cause blood lactate to accumulate and impairs the ability to continue exercise. Most recently, this has become popular with the Norwegian middle distance athlete Jakob Ingebrigsten, who has had considerable international success. Ingebrigtsen’s training philosophy holds that training at lower lactate levels provides a good training stimulus with less requirement for recovery. This, in turn, allows for a greater volume of that training stimulus (science link).
If you want to train according to lactate, you need to get a blood lactate meter that uses pin pricks to get a drop of blood. These are inexpensive enough for the average individual (diabetics who check their blood sugar levels have a similar device). However, lactate training requires repeated blood measurements at different running intensities and over time as your physiology changes. Because it is invasive (but no more than what diabetics deal with), there is a definite inconvenience to the practice. The main point is to know the running speeds that correspond with each lactate range and then update this as needed with consistent and frequent testing.
Carbohydrates and fats
Knowing your energy substrate use can be useful, but I think this is limited to the ultradistances (and perhaps the marathon as well). You use more carbohydrates than fats at higher intensities and at the highest intensity, you use 100% carbohydrates. This is obviously an important consideration for the longer distances because carbohydrate storage in the body is so much less than fat storage, even on the leanest individuals. Running out of carbohydrates can be a race disaster.
Current research suggests, however, that substrate use can be changed if the athlete is adapted to a high-fat diet. This shifts the carbohydrate-fat mix in the direction of fat at the same intensity. If you are going to pursue this method, you will need to either get tested in a university lab, or acquire a consumer grade metabolic sensor.
Rating of perceived exertion
Rating of perceived exertion (RPE) is widely used in the sport and exercise science literature. It was originally designed by Gunnar Borg, a Swedish scientist, as a 6-20 scale to reflect the range of resting to maximum heart rate. Note that this only really applies if your resting heart rate is about 60 bpm and your maximum heart rate is about 200 bpm. A more recent 0-10 scale can also be used, which doesn’t attempt to track heart rate response.
There are few drawbacks to the use of RPE. First, it can be easy to fool yourself that you are running at a certain intensity. For example, for a recovery run, try to be as honest with yourself as you can. If you run too fast, but tell yourself that it is still light or moderate intensity, you will likely hinder your recovery.
Second, it is difficult to use RPE to guide race pace because it will naturally increase as you progress toward the end. My doctoral supervisor Tim Noakes (science link) showed that RPE increases as you get closer to the end. For example if you start at an RPE of 13 at the beginning of a marathon, it will increase in a straight line until it is close to 20 by the end. That’s why you can’t always use RPE to check your pace during a race.
Putting it all together
This section puts everything together in categories that correspond to the different race distances. The variables associated with internal load mean that you need to slow down as the distance increases. This is predictable from the physiology but it is also predictable from race distance. As seen below, your pace decreases in roughly a straight line. This relationship can be seen from 800 m to the marathon.
There are many ways of calculating this relationship to arrive at the most suitable training zones. Remember that the scheme assumes you are equally well trained at each race distance. Since 800 m is vastly different from the marathon, you should not expect to use the method to focus on both since it is not possible to train well for both distances at the same time. Use discretion, knowing that the predictive power decreases the farther away you are from your current main distance.
Horwill method
Frank Horwill (1927-2012) was a British running coach, who proposed that when race distance doubles, your running pace decreases by 4 or 5 seconds per 400 m lap. This corresponds to 16 or 20 seconds per mile. Faster athletes might use the 4 second rule, while slower athletes might use the 5 second rule. This doesn’t mean that slower athletes have relatively worse endurance, just that the 5 second rule scales better with the longer durations for each event if you are in the slow category. I have no specific guideline for these categories, so you need to test and refine according to your individuality, no matter what method you use to guide your training.
Canova method
Renato Canova (Italy) is a marathon coach who coaches in Kenya. He organizes running paces according to the percentage of marathon pace. For example, if your marathon pace is 6:00 per mile:
[marathon pace]
6:00 per mile = 360 seconds
***
[10 k pace]
10% faster = 36 seconds faster
360 – 36 = 324
324 seconds = 5:24 per mile
***
World record percentage method
This one should be used cautiously because the training for a world record attempt is highly specific. As such, it is unlikely that the specific fitness carries over to that same extent to adjacent race distances. It would be close, but not exactly the same level of performance. But, it can be fine to play with the numbers. Here are two examples you might try (as of June 3, 2023):
[men’s 5000 m – 10,000 m]
12:35:36 (Cheptegei) – 26:11:00 (Cheptegei)
10,000 m = 2.079 times 5000 m
***
[women’s 5000 m – 10,000 m]
14:06:62 (Gidey) – 29:01:03 (Gidey)
10,000 m = 2.056 times 5000 m
***
It’s interesting that for both men and women, the same individual holds both records. It’s also interesting that the relationship between the two times are very similar for both men and women (within about 1%). Using both ratios, here are a few sample estimates for regular runners:
[5000 m] 20:00 = 41:08 – 41:35 [10,000 m]
***
[5000 m] 30:00 = 1:01:41 – 1:02:23 [10,000 m]
***
This might predict a 10,000 m that is too fast given the 5000 m time, but remember that professional athletes have more time to spend running long distances (and recovering from those workouts). The average individual doesn’t often have that luxury, so may perform better in the shorter distances because those do require less training time. This is why this method should be used with caution.
Physiological-based intensity chart
| Zone | Pace | % max HR | Lactate (mmol/L) |
| 1 | easy/moderate | 62-82 | 0.7 – 2.0 |
| 2 | marathon | 82-87 | 2.0 – 3.0 |
| 3 | half-marathon | 87-92 | 3.0 – 4.5 |
| 4 | 10,000 m | 92-95 | 4.5 – 7.0 |
| 5 | 3000-5000 m | 95-100 | 7.0 – 11.0 |
| 6 | 800-1500 m | 100 | > 11.0 |
| 7 | sprint | – | – |
Canova pace-based intensity chart
| Distance | % Marathon Pace | If Marathon Pace = 6:00 min/mile | If Marathon Pace = 8:00 min/mile |
| 3000 m | 120 | 4:48 | 6:24 |
| 5000 m | 115 | 5:06 | 6:48 |
| 10,000 m | 110 | 5:24 | 7:12 |
| Half marathon | 105 | 5:42 | 7:36 |
| Marathon | 100 | 6:00 | 8:00 |
| Hard | 95 | 6:18 | 8:24 |
| Medium | 90 | 6:36 | 8:48 |
| Easy | 85 | 6:54 | 9:12 |
| Recovery | 80 | 7:12 | 9:36 |
Horwill pace-based intensity chart
| Example 1 (4 second rule) | Example 2 (5 second rule) | |||
| Distance | Race Time | Pace per 400 m | Race Time | Pace per 400 m |
| 800 m | 2:00 | 60 | 2:30 | 75 |
| 1500 m | 4:00 | 64 | 5:00 | 80 |
| 3000 m | 8:30 | 68 | 10:38 | 85 |
| 5000 m | 15:00 | 72 | 18:45 | 90 |
| 10,000 m | 31:40 | 76 | 39:35 | 95 |
| Half marathon | 1:10:19 | 80 | 1:27:54 | 100 |
| Marathon | 2:27:41 | 84 | 3:04:37 | 105 |
Building a training program
Understanding your individual intensity zones means you understand what constitutes stress and recovery. Stress provides the stimulus for physiological adaptations. Recovery provides time for the adaptations to occur. This sequence done over weeks, months, and years is what ultimately improves fitness.
The total stress over time is formed by intensity, but this must be combined with considerations such as duration and frequency. High intensity for an insufficient duration provides little stimulus. High intensity for a sufficient duration can become too much if done too frequently.
Focusing on your most important race distance
The principle of specificity will guide your running intensity. There are many reasons to employ a wide variation in running paces (far too many for this article). The mix of paces will depend on your goals, experience, and time during the season. The final point I will make, then, is that the intensities that will have the greatest effect on your race performance are those closest to that specific race pace.
Renato Canova suggests that marathon runners will get the greatest benefit from training within 10% of marathon pace. According to his method of calculation, this means 10k race pace and slower. Alternatively, a middle distance runner specializing in the 1500 m might focus on work at 800, 1500, and 3000 m race paces. However, the 1500 m runner must be very careful with this thinking because many middle distance races are not run at an even pace. So, he or she must also recognize the specificity of the finishing kick that demands work done at very fast paces for 100 – 400 m.
Take some time to review the tables above. I believe you will find your place somewhere within, given your own abilities and goals. As you train with the appropriate intensity and recover sufficiently, you will run faster at the same physiological stress, and improve your race performance in the process.
Do you have a method of monitoring your pace or intensity that I missed? Let me know in the comments down below!